Creating Interactive Bokeh Applications with Flask
-
Ethan Cerami
Bokeh is a python library for creating interactive plots and figures. With the bokeh server, you can create fully interactive applications with pull-down menus, sliders and other widgets. This has the advantage that you can create fluid and responsive web applications – for example, as you move a slider bar, your plot can respond and update in real-time. However, bokeh plots may only be one part of larger data analysis platform you are trying to build, and once you move beyond a single small application, it can be hard to scale a bokeh server application to accommodate everything you need.
The alternative that I recommend is to use Python flask for your overall web application framework, and then use Bokeh as one component within that framework. This enables complete control over the platform, and also enables you to more easily integrate other components (even other plotting components) and libraries from the larger python data ecosystem. In doing so, you lose some of the built-in fluidity and responsiveness of bokeh server, but you gain maximum flexibility over the entire platform. It’s also much simpler, as the flask framework is very easy to pick up.
Below, I walk you through the process of building your first “Hello, World” Bokeh-Flask application.
Hello, Flask!
First up is understanding the very basics of Flask. Below is a complete Hello, World Flask application:
# Hello, Flask!
from flask import Flask, render_template, request

app = Flask(__name__)

# Index page, no args
@app.route('/')
def index():
	name = request.args.get("name")
	if name == None:
		name = "Edward"
	return render_template("index.html", name=name)

# With debug=True, Flask server will auto-reload
# when there are code changes
if __name__ == '__main__':
	app.run(port=5000, debug=True)
There are only a few critical pieces to understand:
-
You run the application like so:
python hello_flask.py. This will start your app on localhost, port 5000. -
The
@app.route('/')decorator ties the root URL to theindex()function. Therefore, when a user goes the root URL: http://localhost:5000/, theindex()function is automatically invoked. -
request.args.get("name")retrieves thenameparameter from URL. For example, if you specify a URL like so: http://localhost:5000/?name=Bob, thenameparameter will contain the value “Bob”. -
render_template("index.html", name=name)sends your data to a template and returns the rendered HTML to the browser. More on templating in a minute. -
Lastly,
app.run(port=5000, debug=True)runs your Flask application on the designated port, and crucially setsdebug=True. With debug enabled, Flask will automatically check for code changes and auto-reload these changes. No need to kill Flask and restart it each time you make code changes!
With the above code complete, the last step is to create an HTML template. Note that the template must be located in a templates directory, or Flask will fail to find it. Here is the complete code:
<html>
<body>
Hello, {{ name }}
</body>
</html>
By default, Flask uses the Jinga2 templating engine. This template above simply outputs the name parameter, and the running application should look like this:
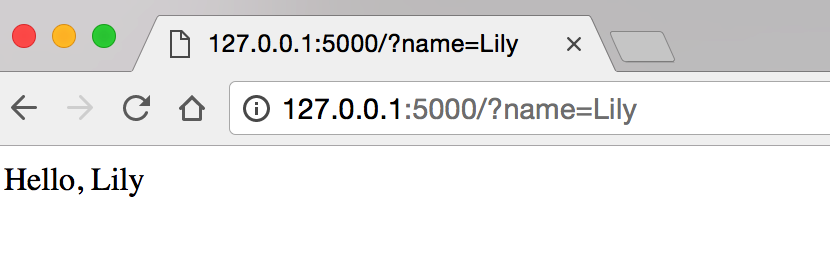
Obviously, there is a great deal more to Flask, but you can actually build quite a bit with just these building blocks (as we will soon see in the example below). For more information on Flask, check out the Flask Mega-Tutorial.
Flask + Bokeh
Next up is to combine Flask and Bokeh. As in my previous post, we will focus on building a ‘hello, world’ plot of the Iris data set, one of the most commonly used data sets in machine learning. The complete code is shown below, and available on github:
from flask import Flask, render_template, request
import pandas as pd
from bokeh.charts import Histogram
from bokeh.embed import components

app = Flask(__name__)

# Load the Iris Data Set
iris_df = pd.read_csv("data/iris.data",
    names=["Sepal Length", "Sepal Width", "Petal Length", "Petal Width", "Species"])
feature_names = iris_df.columns[0:-1].values.tolist()

# Create the main plot
def create_figure(current_feature_name, bins):
	p = Histogram(iris_df, current_feature_name, title=current_feature_name, color='Species',
	 	bins=bins, legend='top_right', width=600, height=400)

	# Set the x axis label
	p.xaxis.axis_label = current_feature_name

	# Set the y axis label
	p.yaxis.axis_label = 'Count'
	return p

# Index page
@app.route('/')
def index():
	# Determine the selected feature
	current_feature_name = request.args.get("feature_name")
	if current_feature_name == None:
		current_feature_name = "Sepal Length"

	# Create the plot
	plot = create_figure(current_feature_name, 10)

	# Embed plot into HTML via Flask Render
	script, div = components(plot)
	return render_template("iris_index1.html", script=script, div=div,
		feature_names=feature_names,  current_feature_name=current_feature_name)

# With debug=True, Flask server will auto-reload
# when there are code changes
if __name__ == '__main__':
	app.run(port=5000, debug=True)
Here are the most crucial points to note:
-
We use Pandas
pd.read_csv()to load the Iris data into a Pandas data frame. -
The
create_figure()function creates a color-coded Bokeh Histogram. -
The
index()function is called on the root URL, and we extract a user supplied feature name viarequest.args.get("feature_name"). -
Within
index(), we callbokeh.embed.components(). This returns javascript code and an HTML div section for rendering your Bokeh plot within an HTML page. These two components are then passed to the template viarender_template().
The complete HTML template is shown below:
<html>
<head>
<link
    href="http://cdn.pydata.org/bokeh/release/bokeh-0.12.5.min.css"
    rel="stylesheet" type="text/css">
<link
    href="http://cdn.pydata.org/bokeh/release/bokeh-widgets-0.12.5.min.css"
    rel="stylesheet" type="text/css">

<script src="http://cdn.pydata.org/bokeh/release/bokeh-0.12.5.min.js"></script>
<script src="http://cdn.pydata.org/bokeh/release/bokeh-widgets-0.12.5.min.js"></script>

</head>
<body>
<H1>Iris Histogram</H1>

<form action="/">
<select name="feature_name">
	{% for feature in feature_names %}
		{% if feature == current_feature_name %}
			<option selected value="{{ feature }}">{{ feature }}</option>
		{% else %}
			<option value="{{ feature }}">{{ feature }}</option>
		{% endif %}
	{% endfor %}
</select>
<input type="submit">
</form>

{{ script|safe }}
{{ div|safe }}

</body>
</html>
The most critical points to note:
-
In the HTML header, I am loading the CSS and Javascript libraries for Bokeh via the pydata content distribution network (CDN). Note that I am explicitly loading bokeh version 0.12.5. Make sure that this matches your local Bokeh version (to upgrade, run:
pip install -U bokeh). -
I have created a
feature_namedrop-down menu for selecting an Iris feature. This is created viaforandifstatements in Jinja2. -
Lastly, I output the bokeh script and div section via the
safetag. Thesafetag indicates that the code you are passing is safe to render within the browser. And, without thesafetag, all the Javascript and HTML code will be automatically escaped and displayed within the browser, but not actually executed.
If all goes well, you should see the final application running like so:
I hope this is helpful. Let me know what you think!